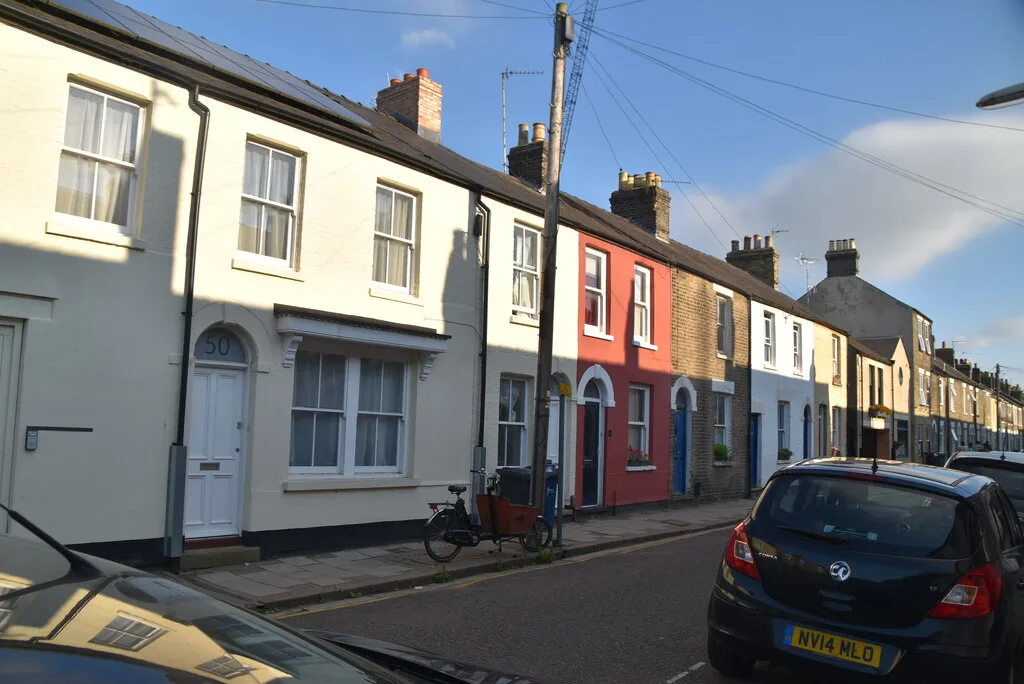

Cambridge homes averaged £471,098 in June, down £5,496 in a year. It is one of 62 English districts to fall, while South Cambridgeshire rose 4.9%.
The average Cambridge home sold for £471,098 in June, down £5,496 on the same month last year. Every other district in Cambridgeshire went up.
Those are the June figures from the UK House Price Index, published by HM Land Registry at 9.30am on 19 August. They are built from completed sales, not asking prices, and they cover the Cambridge city council area rather than the wider county. (HM Land Registry)
Cambridge fell 1.2% over the year. Of the 295 local authority districts in England, 62 fell, and Cambridge had the 37th steepest fall. England as a whole rose 1.8%.
Cambridge against its neighbours
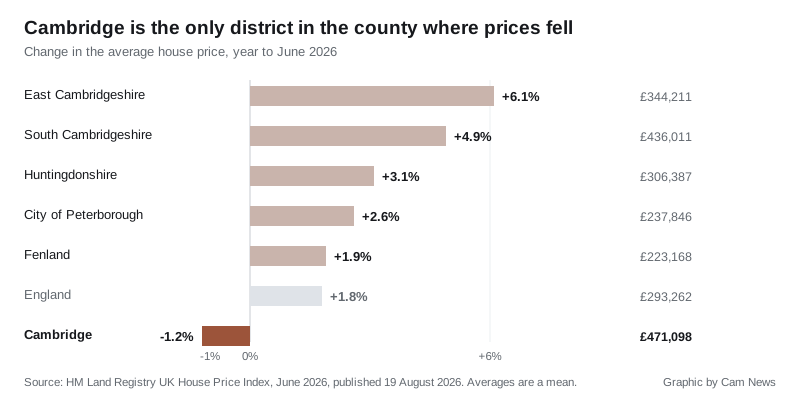
The city is the outlier, and by a wide margin:
| Area | Average, June 2026 | Change on a year |
|---|---|---|
| East Cambridgeshire | £344,211 | +6.1% |
| South Cambridgeshire | £436,011 | +4.9% |
| Huntingdonshire | £306,387 | +3.1% |
| City of Peterborough | £237,846 | +2.6% |
| Fenland | £223,168 | +1.9% |
| England | £293,262 | +1.8% |
| Cambridge | £471,098 | -1.2% |
The practical effect is that the ring around Cambridge is catching up with it. In June 2025 the average Cambridge home cost £61,040 more than the average South Cambridgeshire one. A year later that gap is £35,087. It has closed by more than £25,000 in twelve months, without Cambridge becoming cheap.
Cambridge is still the 46th most expensive of the 295 English districts, and still roughly £178,000 above the England average.
Flats are doing the damage
The fall is not spread evenly. It is concentrated in one property type.
| Type | Average, June 2026 | Change on a year |
|---|---|---|
| Detached | £975,729 | -0.7% |
| Semi-detached | £596,465 | -0.3% |
| Terraced | £488,362 | -0.4% |
| Flat or maisonette | £297,158 | -2.8% |
Flats fell more than six times as fast as terraces. That matters more here than in most towns, and you can see why in the arithmetic. The city’s headline £471,098 sits below the £488,362 average for a terraced house, which only happens where cheap flats make up a large share of the sales being averaged. If you are looking at a house rather than a flat, the headline number is not your number.
The first-time buyer average was £394,131, down 1.1% on the year.
The fall is getting shallower
Cambridge has now recorded 14 consecutive months of annual falls, back to May 2025. But the rate has eased sharply since the winter:
- November 2025: down 3.8% on the year
- January 2026: down 3.8%
- March 2026: down 3.1%
- May 2026: down 1.3%
- June 2026: down 1.2%
June was also up 0.6% on May in cash terms. Two months of small monthly rises do not make a recovery, and the city remains £50,306 below its peak. That peak was £521,404, set in November 2022, so the average Cambridge home is 9.6% cheaper now than it was then.
Two things to know about these numbers
They are a mean, not a median. The UK House Price Index average is pulled upwards by the most expensive sales in the month. It is not the price of a typical Cambridge home, and in a city with a market this uneven the difference is large.
They get revised. When the May figures first came out, the Cambridge average was published as £467,028, a fall of 1.6%. In this month’s release, May has been restated as £468,189 and a fall of 1.3%. Revisions of that size are normal, they run in both directions, and the most recent month is always the least settled. Land Registry also withholds the count of sales for the two most recent months, so there is no published sales volume for May or June yet.
What it means for you
If you are selling in Cambridge, the useful comparison is not last month, it is the village down the road. Anyone who has been waiting for the city market to turn before listing has now watched South Cambridgeshire add 4.9% in the same year the city lost 1.2%. Sellers who move out of the city are buying into a market that has been rising, not falling.
If you are buying, and particularly if you are buying a flat, the city has now been marked down for 14 months straight while the country has not. A £297,158 flat average is £8,700 below where it was a year ago.
If you are staying put, the number that matters is the one against November 2022. On these figures Cambridge has still not recovered the tenth of its value it lost since then, while England has gone the other way: £290,003 in November 2022, £293,262 now.
The July 2026 index is due at 9.30am on Wednesday 16 September. We will update our Cambridge house prices page when it lands.
Sources
- UK House Price Index for June 2026, HM Land Registry, published 19 August 2026
- UK HPI: Cambridge (E07000008)
- District comparisons calculated from the UK HPI full data file for June 2026, which covers all 295 English districts
Have your say