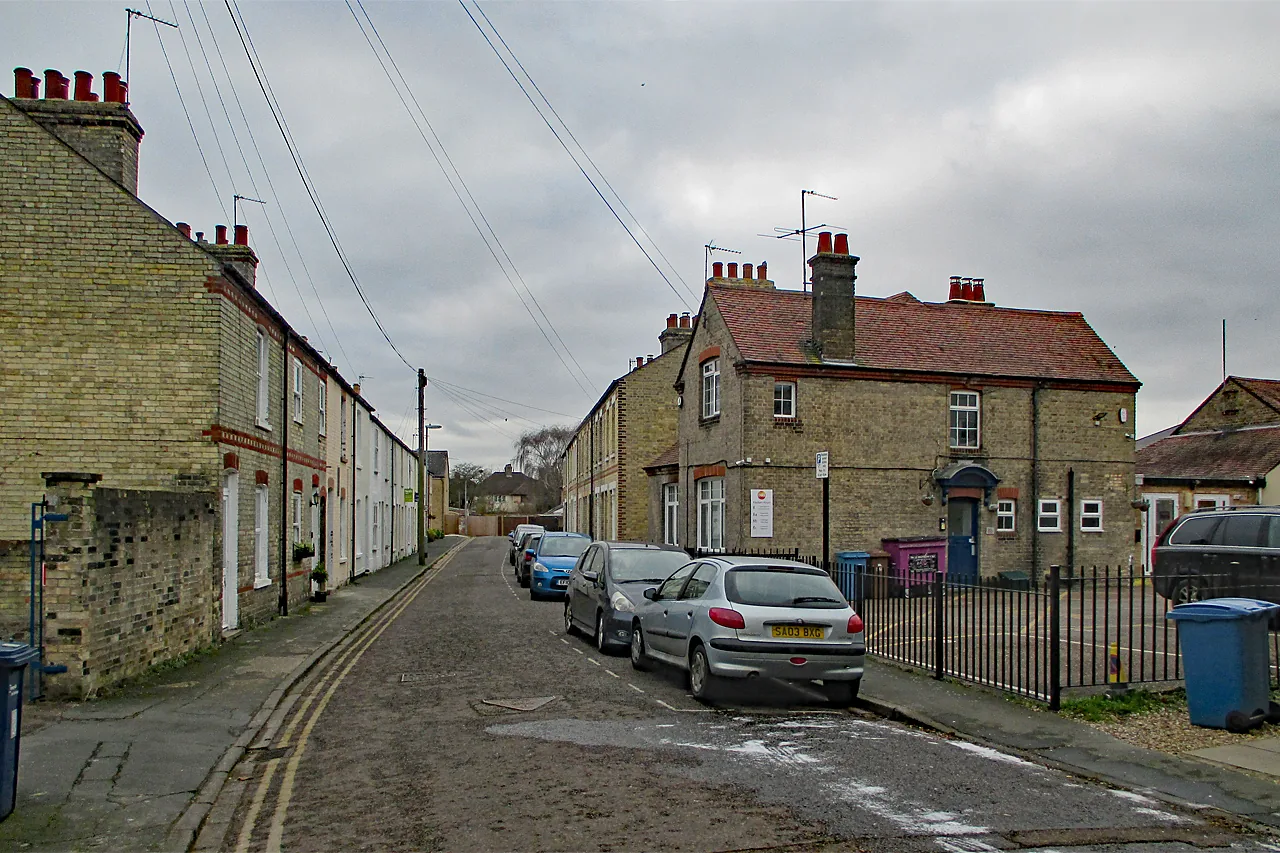

The average Cambridge home sold for £475,151 in July 2026, level on the year after 14 months of falls. Prices by type, and why flats drag the average down.
Cambridge house prices have stopped falling, without yet starting to rise. The average home in the city sold for £475,151 in July 2026, which is £32 more than a year earlier, or 0.0%. That ends fourteen consecutive months in which Cambridge homes were worth less than they had been a year before. Cambridgeshire as a whole was up 2.7% over the same year and England was up 1.1%.
Those are the UK House Price Index figures, built from completed HM Land Registry sales rather than asking prices, and they cover the Cambridge city local authority area, not the wider county. This page is a plain read of them: the headline number, what you actually pay by property type, why the city average is lower than the price of a terraced house, and how Cambridge compares to everywhere around it.
The headline figure
| Measure | July 2026 |
|---|---|
| Average price, all property types | £475,151 |
| Change over 12 months | 0.0% |
| Change over the month | +1.1% |
| First-time buyer average | £397,573 |
| Home mover average | £599,709 |
The monthly figure matters as much as the annual one here. Prices rose 1.1% in July, the third monthly rise in a row, and the annual fall had already been narrowing before that: 1.4% in the year to June, 1.4% in the year to May and 3.5% in the year to April. This is a market that fell through 2025 and has now steadied.
The gap between the two buyer figures is the real cost of moving up in Cambridge. A first-time buyer paid an average of £397,573; somebody selling one home to buy another paid £599,709. That is roughly a £200,000 step, and it is why so many Cambridge families end up looking at South Cambridgeshire instead of a bigger house in the city.
Why the average is lower than a terraced house
This is the number that confuses people about Cambridge, so it is worth setting out plainly. The city average of £475,151 is lower than the average terraced house, which sold for £493,851. That looks impossible until you look at the property mix.
| Property type | Average price | Change over 12 months |
|---|---|---|
| Detached | £979,438 | +0.8% |
| Semi-detached | £603,225 | +1.3% |
| Terraced | £493,851 | +0.9% |
| Flat or maisonette | £298,575 | −2.3% |
Cambridge is a flat-heavy city. Between the student and postgraduate market, the apartment blocks around the station in CB1, and the new flats at Trumpington and along the river, enough sales are flats at £298,575 to pull the all-property average below the price of a two-up two-down on Romsey Terrace. If you are reading a headline Cambridge average and picturing a house, the number you want is £493,851 and upward, not £475,151.
Flats are also the whole reason the city average is flat rather than rising. Every kind of house went up over the year. Flats went down 2.3%, and they are the only category still falling. That fall is easing, though: it was 6.6% in the year to November 2025 and 6.3% in the year to April 2026. Flat buyers are the most exposed to mortgage rates and the least able to wait, and in a city with a lot of buy-to-let and a lot of new-build supply, that shows up quickly in the sold-price data.
How Cambridge compares
Cambridge sits well above the county and the country, and it is still growing more slowly than either.
| Area | Average price | Change over 12 months |
|---|---|---|
| Cambridge city | £475,151 | 0.0% |
| South Cambridgeshire | £439,573 | +2.2% |
| Cambridgeshire | £339,095 | +2.7% |
| East of England | £337,518 | +0.5% |
| England | £293,479 | +1.1% |
Two things stand out. The first is the size of the Cambridge premium: the city average is £136,056 above the Cambridgeshire average and £181,672 above the England average. The second is that Cambridge is still the slowest mover on the list. Every comparator here rose over the year and Cambridge only held level.
The South Cambridgeshire comparison is the one most Cambridge buyers care about. The district average is £35,578 lower than the city, and that gap is closing: a year ago it was £45,062. The mix is different too. South Cambs detached homes average £636,197 against £979,438 in the city, so the saving on a family house is much larger than the headline gap suggests. That is the trade being made every time somebody moves out to Cambourne, Sawston or Great Shelford and takes the train back in.
What it means for you
If you are buying, the window of a clearly falling market has closed, but flats are still where the room is. A 2.3% fall on a £300,000 flat is £6,900 that was not on the table in 2024. Before you fix on an asking price, check what is coming through the planning register nearby and what the roads and parking are like on that side of the city.
If you are selling, the city is not the county. Pricing a Cambridge home off a Cambridgeshire-wide “prices are up 2.7%” headline will leave it sitting. Houses rose by about 1% over the year; flats fell, and a flat priced at 2024 money is unlikely to move.
If you are staying put, holding level after the falls of 2025 leaves the index at 96.0 against a January 2023 base of 100. Cambridge is still 4.0% below where it was at the start of 2023, while England is 2.7% above. In cash terms your home is worth roughly what it was worth last summer. The city peaked at £521,404 in November 2022 and is £46,253 below that now.
Frequently asked questions
What is the average house price in Cambridge?
The average home in Cambridge city sold for £475,151 in July 2026 according to the UK House Price Index, which is built from completed HM Land Registry sales. That covers every property type across the city council area, flats included.
Are Cambridge house prices going up or down?
Neither, as of the latest figures. Prices were level over the year to July 2026, at 0.0%, after falls of 1.4% in the years to June and May and 3.5% in the year to April. The month-on-month figure for July was +1.1%.
How much is a house rather than a flat in Cambridge?
A terraced house averaged £493,851, a semi-detached £603,225 and a detached house £979,438 in July 2026. The city-wide average of £475,151 is lower than all three because flats, at £298,575, make up a large share of Cambridge sales.
Is Cambridge more expensive than South Cambridgeshire?
Yes, and by more than the headline suggests. The city average is £475,151 against £439,573 for South Cambridgeshire, but for detached homes the gap is £979,438 against £636,197, so a family house is dramatically cheaper outside the city boundary.
Where can I check what a specific Cambridge house sold for?
Every completed sale in England and Wales is public. Search a street or an address free on the HM Land Registry Price Paid service.
Sources
- UK House Price Index, Cambridge (ONS / HM Land Registry) for the city average, property-type and buyer-type figures and the annual and monthly changes.
- Land Registry UK HPI open data, Cambridge, July 2026 for the underlying figures quoted here, and the equivalent South Cambridgeshire, Cambridgeshire, East of England and England records for the comparison table.
- The July 2026 index was published on 16 September 2026; the August index is due at 9.30am on Wednesday 21 October 2026. We wrote the release up in full in Cambridge house prices July 2026: falls end at £475,151.
- HM Land Registry Price Paid search to check any individual address.
Figures are provisional and revised as more sales complete, and the index runs two to three months behind. Confirm the latest numbers against the linked ONS and Land Registry sources before making a decision. What is being built next is on Cambridge planning; what the commute costs is on Cambridge to London trains.
Have your say