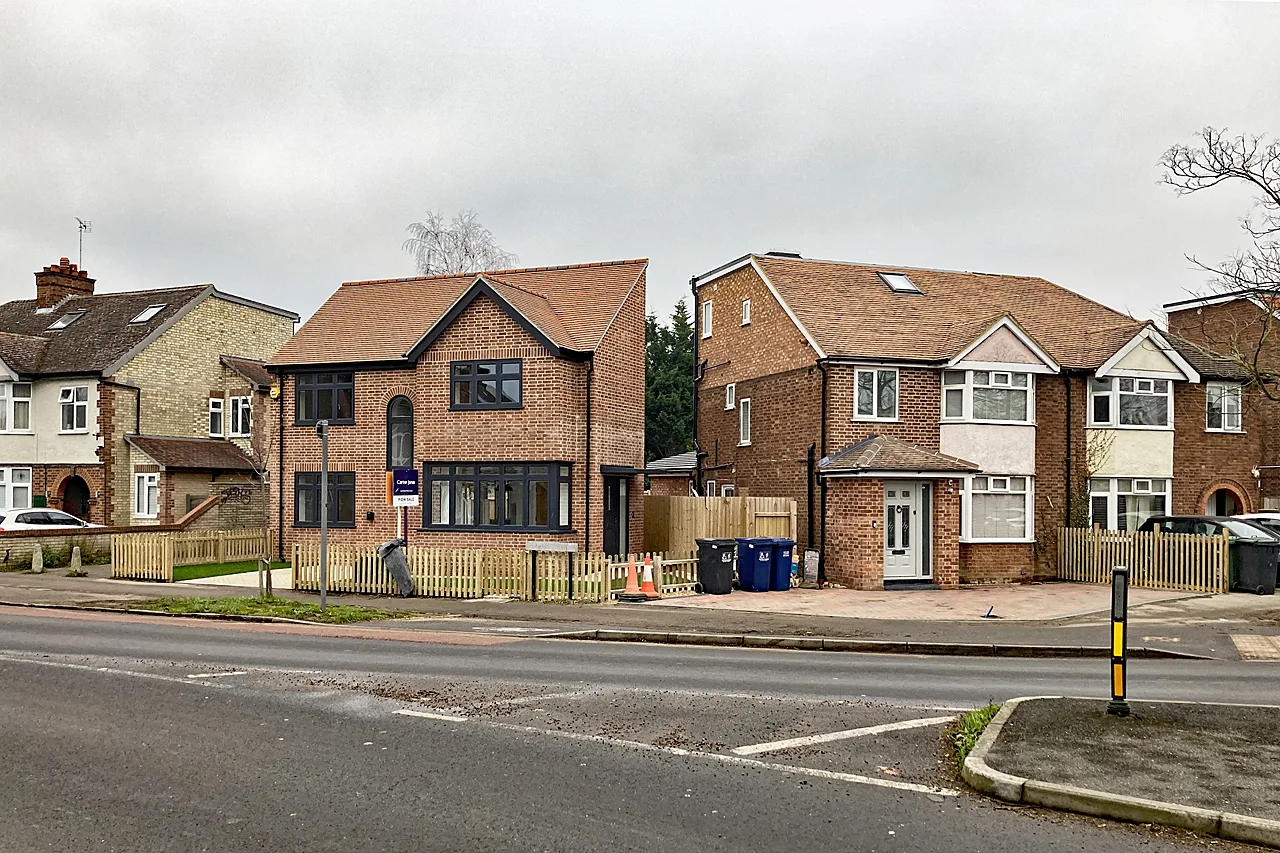

The average Cambridge home reached £475,151 in July, up £32 on a year earlier. It ends fourteen straight months of annual falls, but flats are still down 2.3%.
Cambridge house prices stopped falling in July. The average home in the city was worth £475,151, according to HM Land Registry’s UK House Price Index, published on 16 September.
That is £32 more than a year earlier. As a percentage it rounds to 0.0%.
Thirty-two pounds buys nothing. The point is the direction. Cambridge had recorded an annual fall in every single month from May 2025 to June 2026, fourteen months in a row. July is the first month in that run where the city’s homes were not worth less than they had been a year before.
The picture by property type
The average is a mean, not a median, so a handful of very large sales pull it upwards. Cambridge’s figure is best read alongside the split by type.
| Property type | July 2026 average | Change in a year |
|---|---|---|
| Detached | £979,438 | +0.8% |
| Semi-detached | £603,225 | +1.3% |
| Terraced | £493,851 | +0.9% |
| Flat or maisonette | £298,575 | -2.3% |
| First-time buyer average | £397,573 | -0.2% |
Houses of every kind rose. Flats did not, and flats are the reason the all-property figure is stuck at zero.
There is better news buried in that. The annual fall for Cambridge flats was 6.6% in November 2025 and 6.3% as recently as April. It is now 2.3%, the smallest fall in more than a year. The lowest monthly figure in this run was £293,676 in April 2026, and flats have edged up in each of the three months since.
Cambridge is still the slowest part of the county
Flat is only good news next to falling. It is not good news next to the neighbours. Every shire district in Cambridgeshire grew faster than the city in the year to July.
| Area | July 2026 average | Change in a year |
|---|---|---|
| East Cambridgeshire | £346,413 | +5.8% |
| Fenland | £225,613 | +3.1% |
| Huntingdonshire | £308,374 | +3.1% |
| South Cambridgeshire | £439,573 | +2.2% |
| Cambridge | £475,151 | 0.0% |
| Peterborough | £234,690 | -0.2% |
| England | £293,479 | +1.1% |
Peterborough is the only part of the county still going backwards.
Cambridge remains by far the most expensive place to buy in Cambridgeshire. The city average is £136,056 above the county figure of £339,095 and £181,672 above the England average.
How far the city still is from its peak
The index is set so that January 2023 equals 100. Cambridge stands at 96.0, so prices are 4.0% below where they were at the start of 2023. England is at 102.7 and South Cambridgeshire at 102.9. Both have made back what Cambridge has not.
The city’s highest recorded average was £521,404 in November 2022. July’s figure is £46,253 below that, a fall of 8.9% across three and a half years.
Individual sales published in the same release show the spread behind the averages. A semi-detached house on Henslow Mews in CB2 sold for £1,595,000 on 9 July. A terraced house on Cobholm Place in CB4 sold for £250,000 eight days later. Both are in the same city, in the same month, and both are in the average above. The figures come from HM Land Registry Price Paid Data, which lists every completed sale in England and Wales.
What it means for you
- If you are selling, the market has stopped moving against you, but it has not moved for you either. A Cambridge home is worth roughly what it was worth last summer.
- If you own a flat, you are still behind. The flat index is at 92.0, meaning flats are 8% below their January 2023 value. The rate of decline is slowing, which is the first thing that has to happen before prices recover.
- If you are a first-time buyer, the average first-time buyer price in Cambridge is £397,573, down 0.2% in a year. It is the one category where the figure has come down, slightly.
- If you are looking just outside the city, prices in South Cambridgeshire and East Cambridgeshire are rising faster than in Cambridge, so the gap is closing from the other side.
- The next figures land on Wednesday 21 October, when HM Land Registry publishes the August index.
A note on our June figure
When we reported the June 2026 index on 21 August, the Cambridge average for June was published as £471,098, an annual fall of 1.2%. Land Registry revises the index as more sales are lodged. June now reads £469,993 and a fall of 1.4%. The revision is small, but the figure we published is no longer the one on the register, so we are saying so here.
Related pages: Cambridge house prices, Cambridge council tax bands and Cambridge planning applications.
Sources: HM Land Registry, UK House Price Index for Cambridge; South Cambridgeshire; England; and the UK House Price Index report for July 2026, published 16 September 2026. Price paid data is HM Land Registry open data under the Open Government Licence.
Have your say